Market Outlook
November 21, 2016
Market Cues
Domestic Indices
Chg (%)
(Pts)
(Close)
Indian market is expected to open on a flat note tracking the SGX Nifty.
BSE Sensex
(0.3)
(77)
26,150
The US markets, closed lower on Friday, as a strong rally in the dollar stalled a
Nifty
(0.1)
(6)
8,074
multi-day advance for equities. The S&P 500 closed 0.2%, lower at 2,182 while the
Mid Cap
0.6
73
12,072
Dow Jones Industrial Average declined 0.2%, to 18,868.
Small Cap
0.2
29
11,869
The U.K. index fell by 0.3% on Friday, with commodity shares feeling the weight of
Bankex
(0.6)
(132)
21,727
dollar strength. The pullback follows Thursday’s advance of 0.7%. Next week,
investors will watch for the Conservative government’s U.K. budget plans through its
Global Indices
Chg (%)
(Pts)
(Close)
Autumn Statement. That’s set to be delivered on Wednesday.
Dow Jones
(0.2)
(36)
18,868
Indian stocks posted their fourth straight weekly decline on Friday and the rupee
Nasdaq
(0.2)
(12)
5,322
closed at its lowest in nearly nine months as risk appetite for emerging market assets
FTSE
(0.3)
(19)
6,776
wanes following Republican Donald Trump’s victory in the US presidential race and
rising prospects of a US interest rate hike. The 30-share Sensex closed down 0.3%
Nikkei
0.6
105
17,967
on Friday at 26,150 points and the Nifty shed 0.07% to close at 8,074 points. For
Hang Seng
0.4
81
22,344
the week, the Sensex and Nifty shed 2.49% and 2.68% respectively.
Shanghai Com
(0.5)
(16)
3,193
News Analysis
Advances / Declines
BSE
NSE
Shree Cement in bid to buy Shiva Cement
Advances
1,311
840
Promoter share pledges continue to remain high
Detailed analysis on Pg2
Declines
1,297
759
Unchanged
159
72
Investor’s Ready Reckoner
Key Domestic & Global Indicators
Volumes (` Cr)
Stock Watch: Latest investment recommendations on 150+ stocks
BSE
2,412
Refer Pg5 onwards
NSE
17,641
Top Picks
CMP
Target
Upside
Company
Sector
Rating
Net Inflows (` Cr)
Net
Mtd
Ytd
(`)
(`)
(%)
Amara Raja BatteriesAuto & Auto Ancill.
Buy
938
1,167
24.4
FII
(948)
(8,974)
36,041
HCL Tech
IT
Buy
762
1,000
31.2
MFs
787
6,512
28,564
Asian Granito
Capital Goods
Buy
196
351
79.5
Equitas Holdings
Financials
Buy
157
235
49.5
Top Gainers
Price (`)
Chg (%)
Navkar Corporation Others
Buy
179
265
47.8
Petronet
376
8.4
More Top Picks on Pg3
Shreecem
14,401
6.6
Key Upcoming Events
Enginersin
284
6.5
Previous
Consensus
Date
Region
Event Description
Reading
Expectations
Indianb
262
5.9
Nov 22 Euro Zone Euro-Zone Consumer Confidence
(8.0)
(7.8)
Vakrangee
264
5.5
Nov 22 US
Existing home sales
5.5
5.4
Nov 23 Germany PMI Services
54.2
54.0
Top Losers
Price (`)
Chg (%)
Nov 23 Germany PMI Manufacturing
55.0
54.8
Bergepaint
188
(7.1)
Nov 23 US
Initial Jobless claims
235.0
248.0
More Events on Pg4
Pvr
1,091
(5.0)
Ramcocem
529
(4.7)
Vedl
204
(4.5)
Supremeind
838
(4.5)
As on November 18, 2016
Market Outlook
November 21, 2016
News Analysis
Shree Cement in bid to buy Shiva Cement
Shree Cement has submitted a preliminary offer to buy a majority stake in
Odisha-based cement company, Shiva Cement. Shiva Cement was incorporated
in 1985. The company has an integrated plant located near Rourkela city with an
annual production of close to 200,000 TPA, which is being expanded to 1 MTPA.
The company also has captive limestone reserves in the vicinity and produces both
Portland Slag Cement and Portland Pozzolana Cement, marketed under the
Sumangal brand. Currently, ACC Ltd holds close to 13% in Shiva Cements and, it
also has a right of first refusal in the transaction. Shree Cement is among the
largest cement producers in north India, with an annual production capacity of
27.6 MTPA. The company registered a revenue growth of 18.1% in the last
financial year and it has been on a capacity expansion drive for the past few years.
Promoter share pledges continue to remain high
The pledged shareholdings of company promoters have not changed much over
the past 12 quarters despite many firms selling their assets to pay down debt. The
percentage of holdings pledged by promoters was 10.2% at the end of September,
a marginal increase from the preceding quarter in 70 of BSE 500 companies,
whose promoters have pledged shares for at least 30 quarters. Lack of access to
cheaper capital and no signs of an earnings recovery have hit the mid-sized and
small firms and their promoters hard, experts say.
Among these 70 companies, those belonging to the capital goods sector were the
worst-placed, with 74.91% of the promoters’ holding pledged, followed by banks
and financial institutions at 63.21%. Promoters of Videocon Industries have
pledged almost the entire promoters’ holding in the company. Promoter holdings
of 95.75%, 95.42% and 94.05% of Suzlon Energy, Alok Industries and Gayatri
Projects, respectively, were pledged at the end of the September quarter. Religare
Enterprises saw the biggest jump in terms of the promoters’ pledged holdings for
the September quarter compared to the preceding quarter. Crompton Greaves
promoters’ pledged holdings dropped the most to 58.73% in the September
quarter from 84.2% at the end of the June quarter.
Economic and Political News
GST faces deadlock over administrative control on assesses
GDP to fall, follow-up reforms key, says HSBC
Punjab elections take backseat after currency crisis
Mutual funds eye `1.5 lakhcr inflows from HNIs, retail investors
Corporate News
Petronet LNG’s stellar Q2 triggers earnings upgrades
Demonetisation to hurt toll-road operators in short term
Tata Zest scores 4-star rating in Global NCAP
Market Outlook
November 21, 2016
Top Picks ★★★★★
Large Cap
Market Cap
CMP
Target
Upside
Company
Rationale
(` Cr)
(`)
(`)
(%)
To outpace battery industry growth due to better technological
Amara Raja Batteries
16,027
938
1,167
24.4
products leading to market share gains in both the
automotive OEM and replacement segments.
The stock is trading at attractive valuations and is factoring all
HCL Tech
1,07,563
762
1,000
31.2
the bad news.
Back on the growth trend, expect a long term growth of 14%
Infosys
2,11,273
920
1,249
35.8
to be a US$20bn in FY2020.
Source: Company, Angel Research
Mid Cap
Market Cap
CMP
Target
Upside
Company
Rationale
(` Cr)
(`)
(`)
(%)
We expect the company would report strong profitability
Asian Granito
588
196
351
79.5
owing to better product mix, higher B2C sales and
amalgamation synergy.
Among the top 4 players in the consumer durables segment.
Bajaj Electricals
2,173
215
274
27.3
Improved profitability backed by turn around in E&P segment.
Strong order book lends earnings visibility.
Favourable outlook for the AC industry to augur well for
Cooling products business which is out pacing the market
Blue Star
4,425
464
634
36.6
growth. EMPPAC division's profitability to improve once
operating environment turns around.
With a focus on the low and medium income (LMI) consumer
Dewan Housing Finance
7,134
228
350
53.6
segment, the company has increased its presence in tier-II &
III cities where the growth opportunity is immense.
Strong loan growth backed by diversified loan portfolio and
Equitas Holdings
5,270
157
235
49.5
adequate CAR. ROE & ROA likely to remain decent as risk of
dilution remains low. Attractive valuations considering growth.
Economic recovery to have favourable impact on advertising
& circulation revenue growth. Further, the acquisition of a
Jagran Prakashan
5,685
174
225
29.4
radio business (Radio City) would also boost the company's
revenue growth.
Speedier execution and speedier sales, strong revenue visibilty
Mahindra Lifespace
1,520
371
522
40.9
in short-to-long run, attractive valuations
We expect the company to report strong growth on back of
healthy growth in domestic branded sales (owing to
Mirza International
878
73
107
46.7
aggressive ad spend and addition in the number of EBOs &
multi-brand outlets [MBOs]) and healthy export revenues.
Massive capacity expansion along with rail advantage at ICD
Navkar Corporation
2,557
179
265
47.8
as well CFS augurs well for the company.
Strong brands and distribution network would boost growth
Siyaram Silk Mills
1,148
1,225
1,714
40.0
going ahead. Stock currently trades at an inexpensive
valuation.
Market leadership in Hindi news genre and no. 2 viewership
ranking in English news genre, exit from the radio business,
TV Today Network
1,880
315
385
22.1
and anticipated growth in ad spends by corporates to benefit
the stock.
Source: Company, Angel Research
Market Outlook
November 21, 2016
Key Upcoming Events
Global economic events release calendar
Bloomberg Data
Date
Time
Country
Event Description
Unit
Period
Last Reported
Estimated
Nov 22, 2016 8:30 PM Euro Zone Euro-Zone Consumer Confidence
Value
Nov A
(8.00)
8:30 PM
US
Existing home sales
Million
Oct
5.47
5.45
Nov 23, 2016 2:00 PM Germany PMI Services
Value
Nov P
54.20
2:00 PM Germany PMI Manufacturing
Value
Nov P
55.00
8:30 PM
US
New home sales
Thousands
Oct
593.00
585.00
Nov 24, 2016 12:30 PM Germany GDP nsa (YoY)
% Change
3Q F
1.50
Nov 25, 2016 3:00 PM
UK
GDP (YoY)
% Change
3Q P
2.30
Nov 29, 2016 7:00 PM
US
GDP Qoq (Annualised)
% Change
3Q S
2.90
8:30 PM
US
Consumer Confidence
S.A./ 1985=100
Nov
98.60
Nov 30, 2016 3:00 PM
UK
PMI Manufacturing
Value
Nov
54.30
Dec 01, 2016 2:25 PM Germany Unemployment change (000's)
Thousands
Nov
(13.00)
6:30 AM
China
PMI Manufacturing
Value
Nov
51.20
Dec 02, 2016 7:00 PM
US
Change in Nonfarm payrolls
Thousands
Nov
161.00
7:00 PM
US
Unnemployment rate
%
Nov
4.90
Dec 06, 2016 3:30 PM Euro Zone Euro-Zone GDP s.a. (QoQ)
% Change
3Q F
0.30
Source: Bloomberg, Angel Research
Market Outlook
November 21, 2016
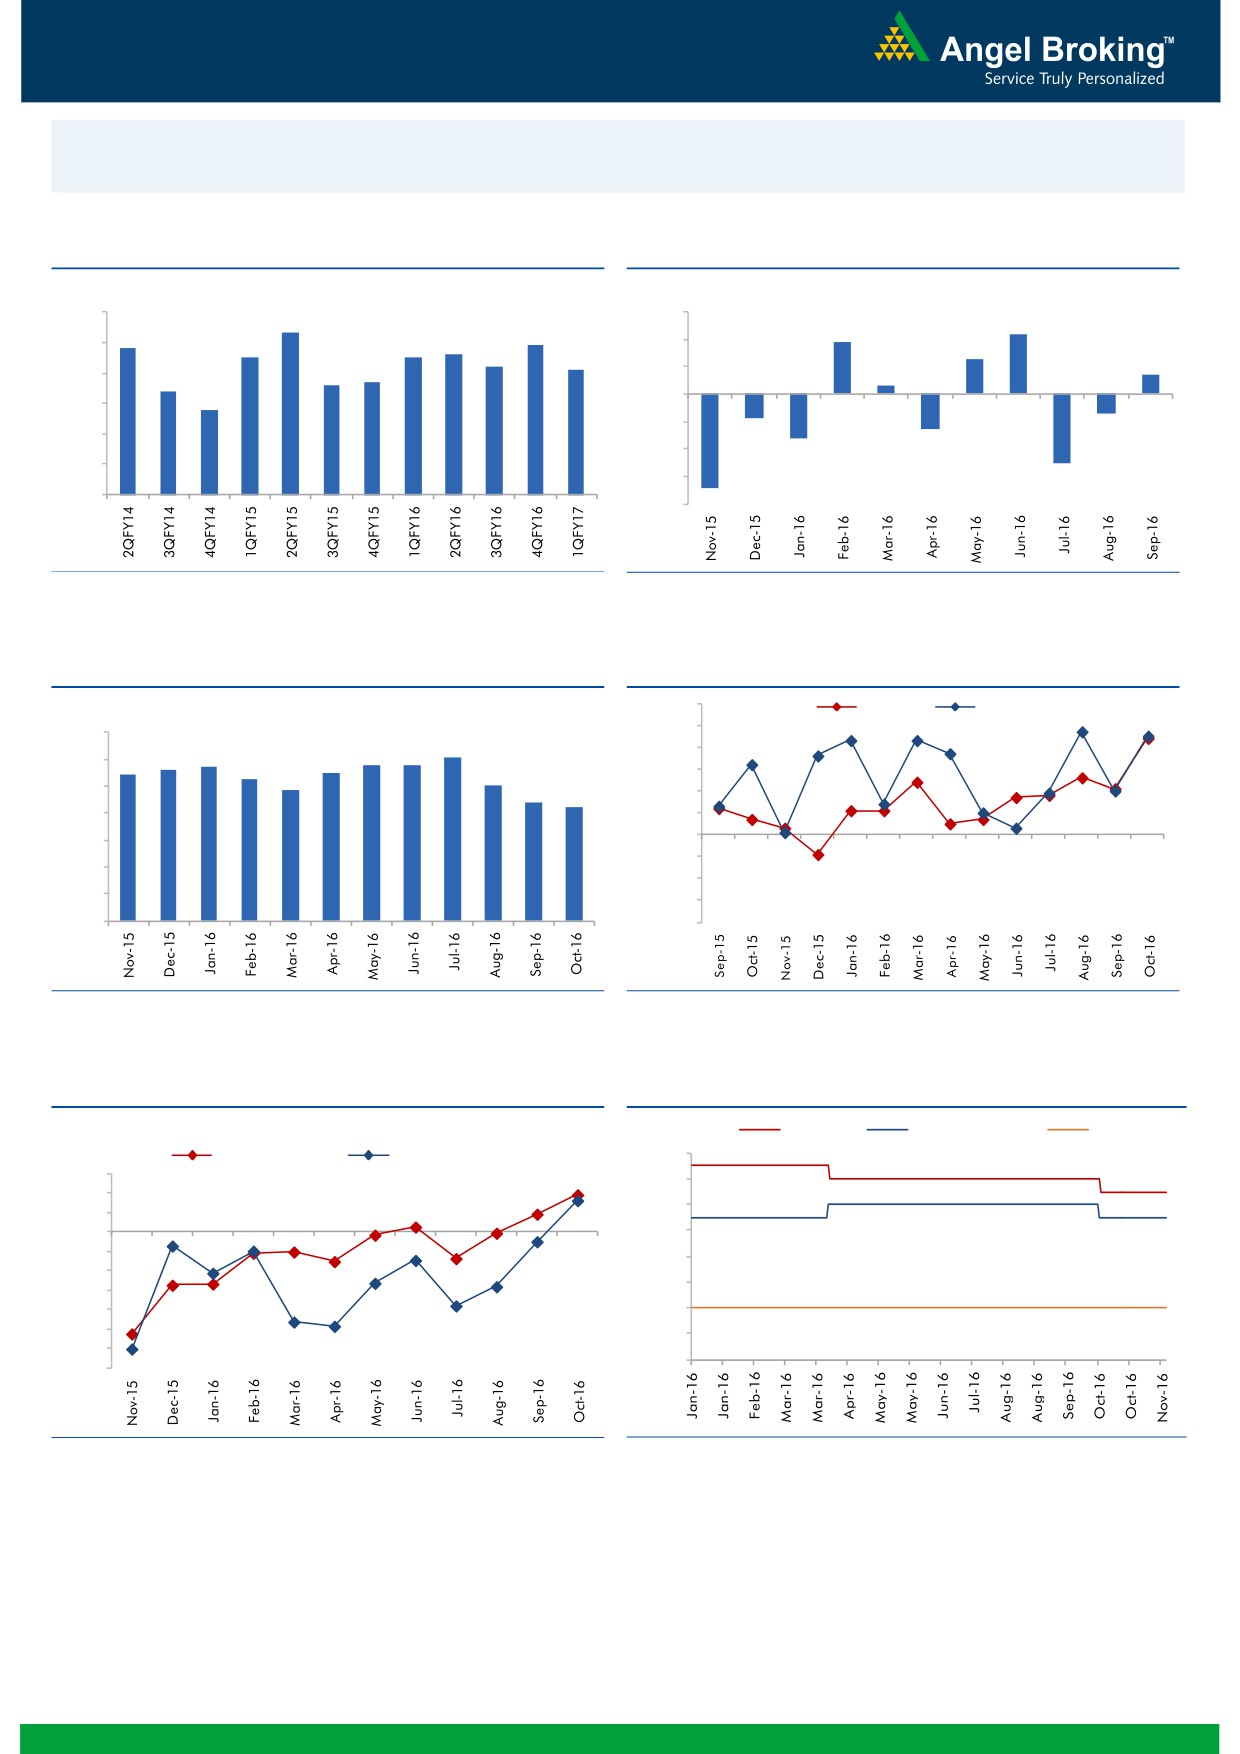
Macro watch
Exhibit 1: Quarterly GDP trends
Exhibit 2: IIP trends
(%)
(%)
9.0
3.0
8.3
2.2
7.9
1.9
7.8
8.0
7.5
7.5
7.6
2.0
1.3
7.2
7.1
0.7
6.6
6.7
1.0
0.3
7.0
6.4
5.8
-
6.0
(1.0)
5.0
(0.9)
(0.7)
(2.0)
(1.3)
(1.6)
4.0
(3.0)
(2.5)
3.0
(4.0)
(3.4)
Source: CSO, Angel Research
Source: MOSPI, Angel Research
Exhibit 3: Monthly CPI inflation trends
Exhibit 4: Manufacturing and services PMI
56.0
Mfg. PMI
Services PMI
(%)
55.0
7.0
6.1
5.7
5.8
5.8
54.0
6.0
5.4
5.6
5.5
5.3
5.1
53.0
4.8
5.0
4.4
4.2
52.0
4.0
51.0
3.0
50.0
49.0
2.0
48.0
1.0
47.0
-
46.0
Source: MOSPI, Angel Research
Source: Market, Angel Research; Note: Level above 50 indicates expansion
Exhibit 5: Exports and imports growth trends
Exhibit 6: Key policy rates
c
(%)
Repo rate
Reverse Repo rate
CRR
(%)
Exports yoy growth
Imports yoy growth
7.00
15.0
6.50
10.0
6.00
5.0
0.0
5.50
(5.0)
5.00
(10.0)
4.50
(15.0)
(20.0)
4.00
(25.0)
3.50
(30.0)
3.00
(35.0)
Source: Bloomberg, Angel Research
Source: RBI, Angel Research
Market Outlook
November 21, 2016
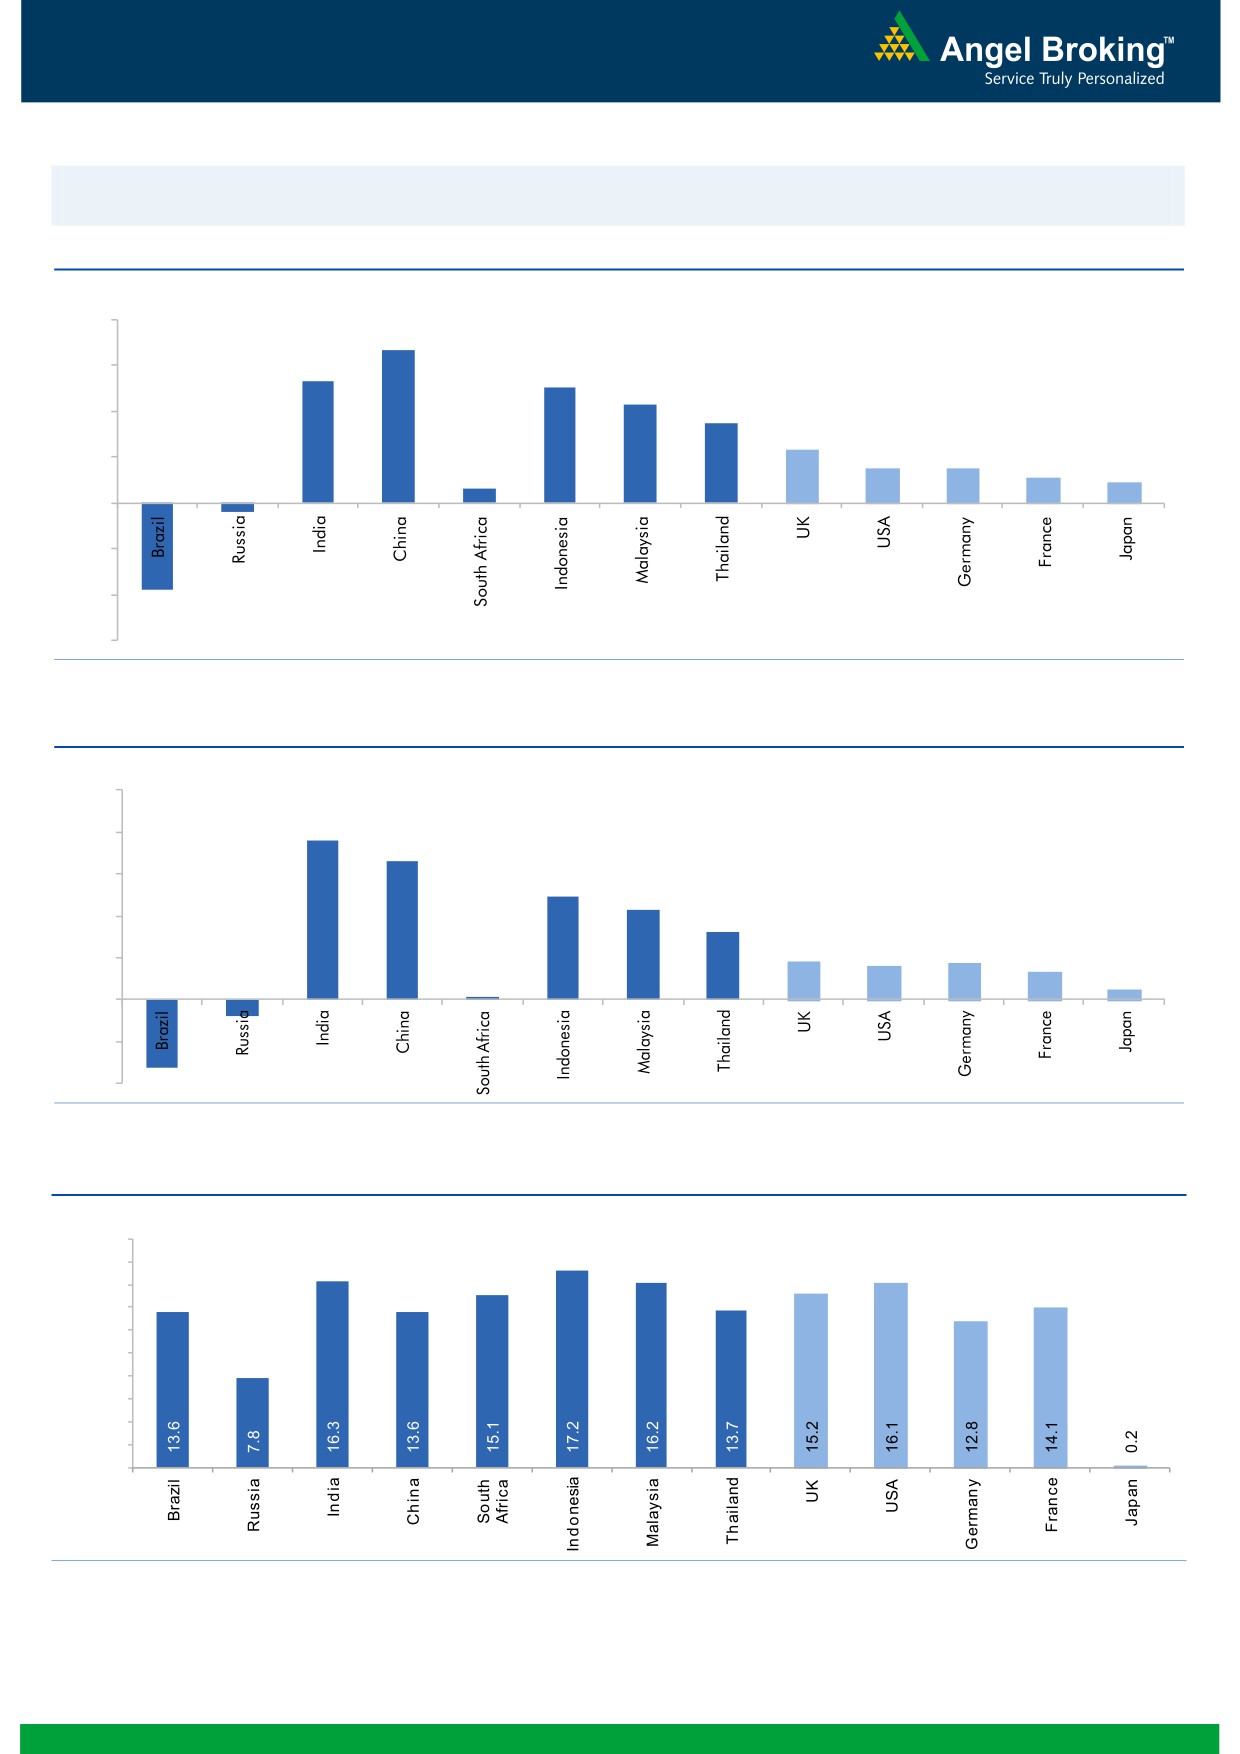
Global watch
Exhibit 1: Latest quarterly GDP Growth (%, yoy) across select developing and developed countries
(%)
8.0
6.7
6.0
5.3
0.6
5.0
4.3
3.5
4.0
2.3
1.5
1.5
2.0
1.1
0.9
-
(2.0)
(0.4)
(4.0)
(3.8)
(6.0)
Source: Bloomberg, Angel Research
Exhibit 2: 2016 GDP Growth projection by IMF (%, yoy) across select developing and developed countries
(%)
10.0
7.6
8.0
6.6
6.0
4.9
4.3
4.0
3.2
1.8
1.7
1.6
1.3
2.0
(0.8)
0.5
(3.3)
0.1
-
(2.0)
(4.0)
Source: IMF, Angel Research
Exhibit 3: One year forward P-E ratio across select developing and developed countries
(x)
20.0
18.0
16.0
14.0
12.0
10.0
8.0
6.0
4.0
2.0
-
Source: IMF, Angel Research
Market Outlook
November 21, 2016
Exhibit 4: Relative performance of indices across globe
Returns (%)
Country
Name of index
Closing price
1M
3M
1YR
Brazil
Bovespa
59,962
(4.4)
1.9
27.9
Russia
Micex
2,038
3.5
4.0
12.6
India
Nifty
8,074
(7.0)
(6.9)
3.7
China
Shanghai Composite
3,193
3.5
6.3
(12.3)
South Africa
Top 40
44,217
(1.6)
(3.9)
(4.8)
Mexico
Mexbol
44,364
(7.8)
(8.4)
(0.9)
Indonesia
LQ45
868
(6.8)
(6.9)
15.0
Malaysia
KLCI
1,624
(2.7)
(4.5)
(2.4)
Thailand
SET 50
917
(2.2)
(6.5)
1.5
USA
Dow Jones
18,868
3.7
1.7
5.9
UK
FTSE
6,776
(3.5)
(1.2)
7.5
Japan
Nikkei
17,967
5.9
8.3
(8.7)
Germany
DAX
10,665
0.2
1.1
(3.9)
France
CAC
4,504
(0.4)
2.6
(8.6)
Source: Bloomberg, Angel Research
Stock Watch
November 21, 2016
Company Name
Reco
CMP
Target
Mkt Cap
Sales ( Čcr )
OPM(%)
EPS (Č)
PER(x)
P/BV(x)
RoE(%)
EV/Sales(x)
(Č)
Price ( Č)
( Č cr )
FY17E FY18E
FY17E
FY18E
FY17E
FY18E
FY17E
FY18E
FY17E
FY18E
FY17E
FY18E
FY17E
FY18E
Agri / Agri Chemical
Rallis
Accumulate
188
209
3,654
1,937
2,164
13.3
14.3
9.0
11.0
20.9
17.1
3.6
3.2
18.4
19.8
1.9
1.7
United Phosphorus
Accumulate
623
684
31,576
15,176
17,604
18.5
18.5
37.4
44.6
16.7
14.0
3.3
2.7
21.4
21.2
2.2
1.8
Auto & Auto Ancillary
Ashok Leyland
Buy
80
111
22,653
22,407
26,022
10.6
10.6
5.2
6.4
15.3
12.4
3.5
2.9
23.6
24.7
1.1
0.9
Bajaj Auto
Neutral
2,575
-
74,500
25,093
27,891
19.5
19.2
143.9
162.5
17.9
15.9
5.0
4.3
30.3
29.4
2.7
2.4
Bharat Forge
Neutral
907
-
21,124
7,726
8,713
20.5
21.2
35.3
42.7
25.7
21.3
4.8
4.3
18.9
20.1
2.8
2.4
Eicher Motors
Neutral
21,792
-
59,190
16,583
20,447
17.5
18.0
598.0
745.2
36.4
29.2
12.5
9.5
41.2
38.3
3.4
2.7
Gabriel India
Buy
108
130
1,557
1,544
1,715
9.0
9.3
5.4
6.3
20.1
17.2
3.8
3.4
18.9
19.5
1.0
0.9
Hero Motocorp
Buy
2,935
3,541
58,603
30,958
34,139
15.7
15.7
193.6
208.3
15.2
14.1
5.9
4.9
34.2
30.5
1.7
1.6
Jamna Auto Industries Neutral
186
-
1,489
1,486
1,620
9.8
9.9
15.0
17.2
12.4
10.8
2.7
2.3
21.8
21.3
1.1
1.0
L G Balakrishnan & Bros Neutral
596
-
935
1,302
1,432
11.6
11.9
43.7
53.0
13.6
11.2
1.9
1.8
13.8
14.2
0.8
0.7
Mahindra and Mahindra Neutral
1,239
-
76,956
46,534
53,077
11.6
11.7
67.3
78.1
18.4
15.9
3.0
2.6
15.4
15.8
1.6
1.4
Maruti
Buy
4,960
6,006
149,838
68,057
82,958
15.8
15.5
212.1
261.2
23.4
19.0
4.6
3.9
19.8
20.3
1.9
1.5
Minda Industries
Neutral
295
-
2,341
2,728
3,042
9.0
9.1
68.2
86.2
4.3
3.4
1.0
0.8
23.8
24.3
0.9
0.8
Motherson Sumi
Neutral
291
-
40,811
45,896
53,687
7.8
8.3
13.0
16.1
22.3
18.1
7.2
5.7
34.7
35.4
1.0
0.8
Rane Brake Lining
Neutral
849
-
672
511
562
11.3
11.5
28.1
30.9
30.2
27.5
4.6
4.2
15.3
15.0
1.5
1.3
Setco Automotive
Neutral
37
-
497
741
837
13.0
13.0
15.2
17.0
2.5
2.2
0.4
0.4
15.8
16.3
1.1
1.0
Tata Motors
Neutral
471
-
135,987
300,209
338,549
8.9
8.4
42.7
54.3
11.0
8.7
1.8
1.5
15.6
17.2
0.6
0.5
TVS Motor
Neutral
362
-
17,215
13,390
15,948
6.9
7.1
12.8
16.5
28.4
21.9
7.1
5.6
26.3
27.2
1.3
1.1
Amara Raja Batteries
Buy
938
1,167
16,027
5,504
6,605
18.4
19.8
33.4
40.9
28.1
22.9
6.2
5.0
22.1
22.0
2.9
2.4
Exide Industries
Neutral
178
-
15,160
7,439
8,307
15.0
15.0
8.1
9.3
22.0
19.2
3.1
2.8
14.3
16.7
1.7
1.5
Apollo Tyres
Buy
189
235
9,618
12,877
14,504
14.3
13.9
21.4
23.0
8.8
8.2
1.4
1.2
16.4
15.2
0.9
0.9
Ceat
Buy
1,208
1,450
4,885
7,524
8,624
13.0
12.7
131.1
144.3
9.2
8.4
1.7
1.4
19.8
18.6
0.7
0.6
JK Tyres
Neutral
123
-
2,785
7,455
8,056
15.0
15.0
21.8
24.5
5.6
5.0
1.2
1.0
22.8
21.3
0.5
0.4
Swaraj Engines
Neutral
1,325
-
1,646
660
810
15.2
16.4
54.5
72.8
24.3
18.2
7.6
6.9
31.5
39.2
2.3
1.9
Subros
Neutral
147
-
885
1,488
1,681
11.7
11.9
6.4
7.2
23.0
20.6
2.4
2.2
10.8
11.4
0.8
0.7
Indag Rubber
Neutral
162
-
424
286
326
19.8
16.8
11.7
13.3
13.8
12.1
2.3
2.2
17.8
17.1
1.2
1.0
Capital Goods
ACE
Neutral
43
-
430
709
814
4.1
4.6
1.4
2.1
31.0
20.7
1.3
1.2
4.4
6.0
0.8
0.7
BEML
Neutral
820
-
3,417
3,451
4,055
6.3
9.2
31.4
57.9
26.1
14.2
1.6
1.4
6.3
10.9
1.1
0.9
Bharat Electronics
Accumulate
1,308
1,414
29,214
8,137
9,169
16.8
17.2
58.7
62.5
22.3
20.9
3.5
3.1
44.6
46.3
2.6
2.3
Stock Watch
November 21, 2016
Company Name
Reco
CMP
Target
Mkt Cap
Sales ( Čcr )
OPM(%)
EPS (Č)
PER(x)
P/BV(x)
RoE(%)
EV/Sales(x)
(Č)
Price ( Č)
( Č cr )
FY17E
FY18E
FY17E
FY18E
FY17E
FY18E
FY17E
FY18E
FY17E
FY18E
FY17E
FY18E
FY17E
FY18E
Capital Goods
Voltas
Buy
293
407
9,695
6,511
7,514
7.9
8.7
12.9
16.3
22.7
18.0
4.1
3.6
16.7
18.5
1.2
1.0
BGR Energy
Neutral
105
-
757
16,567
33,848
6.0
5.6
7.8
5.9
13.4
17.8
0.8
0.7
4.7
4.2
0.1
0.1
BHEL
Neutral
134
-
32,847
28,797
34,742
-
2.8
2.3
6.9
58.4
19.5
1.0
1.0
1.3
4.8
0.8
0.6
Blue Star
Buy
464
634
4,425
4,283
5,077
5.9
7.3
14.9
22.1
31.2
21.0
6.1
5.1
20.4
26.4
1.1
0.9
Crompton Greaves
Neutral
73
-
4,560
5,777
6,120
5.9
7.0
3.3
4.5
22.1
16.2
1.0
0.9
4.4
5.9
0.7
0.6
Greaves Cotton
Neutral
125
-
3,055
1,755
1,881
16.8
16.9
7.8
8.5
16.0
14.7
3.2
3.0
20.6
20.9
1.4
1.3
Inox Wind
Neutral
181
-
4,024
5,605
6,267
15.7
16.4
24.8
30.0
7.3
6.0
2.0
1.5
25.9
24.4
0.8
0.6
KEC International
Neutral
139
-
3,570
9,294
10,186
7.9
8.1
9.9
11.9
14.0
11.7
2.1
1.8
15.6
16.3
0.6
0.6
Thermax
Neutral
834
-
9,937
5,421
5,940
7.3
7.3
25.7
30.2
32.5
27.6
3.9
3.6
12.2
13.1
1.7
1.6
VATech Wabag
Buy
497
681
2,710
3,136
3,845
8.9
9.1
26.0
35.9
19.1
13.9
2.4
2.0
13.4
15.9
0.8
0.6
Cement
ACC
Neutral
1,312
-
24,629
11,225
13,172
13.2
16.9
44.5
75.5
29.5
17.4
2.8
2.6
11.2
14.2
2.2
1.9
Ambuja Cements
Neutral
199
-
39,504
9,350
10,979
18.2
22.5
5.8
9.5
34.3
20.9
2.9
2.6
10.2
12.5
4.2
3.6
India Cements
Neutral
117
-
3,592
4,364
4,997
18.5
19.2
7.9
11.3
14.8
10.4
1.1
1.0
8.0
8.5
1.6
1.4
JK Cement
Neutral
698
-
4,877
4,398
5,173
15.5
17.5
31.2
55.5
22.4
12.6
2.7
2.3
12.0
15.5
1.7
1.4
J K Lakshmi Cement
Buy
351
565
4,127
2,913
3,412
14.5
19.5
7.5
22.5
46.8
15.6
2.9
2.4
12.5
18.0
2.0
1.7
Orient Cement
Buy
134
215
2,735
2,114
2,558
18.5
20.5
8.1
11.3
16.5
11.8
2.4
2.1
9.0
14.0
1.9
1.5
UltraTech Cement
Neutral
3,393
-
93,117
25,768
30,385
21.0
23.5
111.0
160.0
30.6
21.2
3.9
3.4
13.5
15.8
3.7
3.1
Construction
ITNL
Neutral
91
-
3,008
8,946
10,017
31.0
31.6
8.1
9.1
11.3
10.1
0.4
0.4
4.2
5.0
3.7
3.4
KNR Constructions
Accumulate
739
802
2,078
1,385
1,673
14.7
14.0
41.2
48.5
17.9
15.2
3.3
2.9
14.9
15.2
1.6
1.3
Larsen & Toubro
Buy
1,369
1,700
127,583
67,665
77,249
10.7
11.5
57.3
71.2
23.9
19.2
2.2
2.1
12.6
14.3
2.1
1.8
Gujarat Pipavav Port
Neutral
137
-
6,616
705
788
52.2
51.7
5.0
5.6
27.4
24.4
2.7
2.4
11.2
11.2
9.0
7.6
Nagarjuna Const.
Neutral
79
-
4,389
8,842
9,775
9.1
8.8
5.3
6.4
14.9
12.3
1.2
1.1
8.2
9.1
0.7
0.6
PNC Infratech
Buy
114
143
2,935
2,350
2,904
13.1
13.2
9.0
8.8
12.7
13.0
0.5
0.4
15.9
13.9
1.4
1.1
Simplex Infra
Neutral
306
-
1,514
6,829
7,954
10.5
10.5
31.4
37.4
9.8
8.2
1.0
0.9
9.9
13.4
0.6
0.5
Power Mech Projects
Neutral
437
-
642
1,801
2,219
12.7
14.6
72.1
113.9
6.1
3.8
1.1
0.9
16.8
11.9
0.4
0.3
Sadbhav Engineering
Accumulate
282
298
4,842
3,598
4,140
10.3
10.6
9.0
11.9
31.4
23.7
3.3
2.9
9.9
11.9
1.6
1.4
NBCC
Neutral
220
-
13,191
7,428
9,549
7.9
8.6
8.2
11.0
26.8
20.0
1.3
1.1
28.2
28.7
1.5
1.1
MEP Infra
Neutral
37
-
607
1,877
1,943
30.6
29.8
3.0
4.2
12.5
8.9
6.0
4.1
0.6
0.6
1.7
1.5
SIPL
Neutral
90
-
3,152
1,036
1,252
65.5
66.2
(8.4)
(5.6)
3.4
3.8
(22.8)
(15.9)
11.3
9.4
Stock Watch
November 21, 2016
Company Name
Reco
CMP
Target
Mkt Cap
Sales ( Čcr )
OPM(%)
EPS (Č)
PER(x)
P/BV(x)
RoE(%)
EV/Sales(x)
(Č)
Price ( Č)
( Č cr )
FY17E
FY18E
FY17E
FY18E
FY17E
FY18E
FY17E
FY18E
FY17E
FY18E
FY17E
FY18E
FY17E
FY18E
Construction
Engineers India
Neutral
284
-
9,556
1,725
1,935
16.0
19.1
11.4
13.9
24.9
20.4
3.4
3.3
13.4
15.3
4.5
4.0
Financials
Axis Bank
Buy
473
630
113,001
46,932
53,575
3.5
3.4
32.4
44.6
14.6
10.6
1.9
1.6
13.6
16.5
-
-
Bank of Baroda
Neutral
177
-
40,715
19,980
23,178
1.8
1.8
11.5
17.3
15.4
10.2
1.8
1.5
8.3
10.1
-
-
Canara Bank
Neutral
326
-
17,718
15,225
16,836
1.8
1.8
14.5
28.0
22.5
11.7
1.6
1.3
5.8
8.5
-
-
Dewan Housing Finance Buy
228
350
7,134
2,225
2,688
2.9
2.9
29.7
34.6
7.7
6.6
1.2
1.1
16.1
16.8
-
-
Equitas Holdings
Buy
157
235
5,270
939
1,281
11.7
11.5
5.8
8.2
27.1
19.2
2.3
2.1
10.9
11.5
-
-
Federal Bank
Neutral
71
-
12,216
9,353
10,623
2.9
2.9
4.4
5.8
16.2
12.3
1.6
1.4
9.5
11.0
-
-
HDFC
Neutral
1,251
-
197,763
11,475
13,450
3.4
3.4
45.3
52.5
27.6
23.8
5.3
4.7
20.2
20.5
-
-
HDFC Bank
Accumulate
1,212
1,350
306,746
46,097
55,433
4.5
4.5
58.4
68.0
20.8
17.8
3.6
3.0
18.8
18.6
-
-
ICICI Bank
Buy
265
315
153,946
42,800
44,686
3.1
3.3
18.0
21.9
14.7
12.1
2.0
1.9
11.1
12.3
-
-
LIC Housing Finance
Buy
518
630
26,154
3,712
4,293
2.6
2.5
39.0
46.0
13.3
11.3
2.5
2.1
19.9
20.1
-
-
Punjab Natl.Bank
Neutral
150
-
31,856
23,532
23,595
2.3
2.4
6.8
12.6
22.0
11.9
3.4
2.4
3.3
6.5
-
-
RBL Bank
Neutral
339
-
12,535
1,783
2,309
2.6
2.6
12.7
16.4
26.7
20.7
2.9
2.6
12.8
13.3
-
-
South Ind.Bank
Neutral
22
-
2,991
6,435
7,578
2.5
2.5
2.7
3.1
8.2
7.2
1.1
0.9
10.1
11.2
-
-
St Bk of India
Neutral
276
-
214,020
88,650
98,335
2.6
2.6
13.5
18.8
20.4
14.7
1.9
1.7
7.0
8.5
-
-
Union Bank
Neutral
157
-
10,810
13,450
14,925
2.3
2.3
25.5
34.5
6.2
4.6
0.9
0.8
7.5
10.2
-
-
Yes Bank
Neutral
1,180
-
49,671
8,978
11,281
3.3
3.4
74.0
90.0
15.9
13.1
3.0
2.6
17.0
17.2
-
-
FMCG
Asian Paints
Neutral
907
-
87,023
17,128
18,978
16.8
16.4
19.1
20.7
47.5
43.8
16.5
15.6
34.8
35.5
5.0
4.5
Britannia
Buy
2,902
3,626
34,817
9,594
11,011
14.6
14.9
80.3
94.0
36.1
30.9
14.9
11.5
41.2
-
3.5
3.0
Colgate
Accumulate
917
995
24,945
4,605
5,149
23.4
23.4
23.8
26.9
38.5
34.1
21.3
16.7
64.8
66.8
5.3
4.8
Dabur India
Accumulate
278
304
48,843
8,315
9,405
19.8
20.7
8.1
9.2
34.3
30.2
9.5
7.9
31.6
31.0
5.5
4.9
GlaxoSmith Con*
Neutral
4,958
-
20,852
4,350
4,823
21.2
21.4
179.2
196.5
27.7
25.2
7.4
6.2
27.1
26.8
4.2
3.7
Godrej Consumer
Neutral
1,421
-
48,400
10,235
11,428
18.4
18.6
41.1
44.2
34.6
32.2
7.7
6.5
24.9
24.8
4.8
4.2
HUL
Neutral
804
-
173,973
35,252
38,495
17.8
17.8
20.7
22.4
38.9
35.9
37.2
31.9
95.6
88.9
4.8
4.4
ITC
Buy
228
284
275,094
40,059
44,439
38.3
39.2
9.0
10.1
25.4
22.5
7.1
6.2
27.8
27.5
6.4
5.7
Marico
Buy
249
300
32,164
6,430
7,349
18.8
19.5
6.4
7.7
39.0
32.4
11.8
9.9
33.2
32.5
4.8
4.2
Nestle*
Neutral
5,892
-
56,811
10,073
11,807
20.7
21.5
124.8
154.2
47.2
38.2
19.4
17.4
34.8
36.7
5.5
4.6
Tata Global
Neutral
120
-
7,580
8,675
9,088
9.8
9.8
7.4
8.2
16.2
14.7
1.8
1.8
7.9
8.1
0.8
0.7
Procter & Gamble
Accumulate
6,528
7,369
21,191
2,939
3,342
23.2
23.0
146.2
163.7
44.7
39.9
100.0
95.9
25.3
23.5
6.8
5.9
Hygiene
Stock Watch
November 21, 2016
Company Name
Reco
CMP
Target
Mkt Cap
Sales ( Čcr )
OPM(%)
EPS (Č)
PER(x)
P/BV(x)
RoE(%)
EV/Sales(x)
(Č)
Price ( Č)
( Č cr )
FY17E FY18E
FY17E
FY18E
FY17E
FY18E
FY17E
FY18E
FY17E
FY18E
FY17E
FY18E
FY17E
FY18E
IT
HCL Tech^
Buy
762
1,000
107,563
49,242
57,168
20.5
20.5
55.7
64.1
13.7
11.9
2.8
2.1
20.3
17.9
2.0
1.7
Infosys
Buy
920
1,249
211,273
68,350
77,326
27.0
27.0
62.5
69.4
14.7
13.3
3.1
2.9
21.3
21.6
2.5
2.2
TCS
Buy
2,123
2,620
418,351
119,025
133,308
27.6
27.6
131.2
145.5
16.2
14.6
5.2
4.8
32.4
33.1
3.3
2.9
Tech Mahindra
Buy
445
600
43,220
29,673
32,937
15.5
17.0
32.8
39.9
13.6
11.2
2.7
2.3
19.6
20.7
1.2
1.0
Wipro
Buy
437
590
106,247
55,440
60,430
18.1
18.1
35.9
39.9
12.2
11.0
2.2
2.0
19.0
19.3
1.6
1.5
Media
D B Corp
Neutral
375
-
6,892
2,297
2,590
27.4
28.2
21.0
23.4
17.9
16.0
4.2
3.6
23.7
23.1
2.8
2.4
HT Media
Neutral
73
-
1,705
2,693
2,991
12.6
12.9
7.9
9.0
9.3
8.1
0.8
0.7
7.8
8.3
0.2
0.1
Jagran Prakashan
Buy
174
225
5,685
2,355
2,635
28.0
28.0
10.8
12.5
16.1
13.9
3.5
3.0
21.7
21.7
2.4
2.1
Sun TV Network
Neutral
459
-
18,088
2,850
3,265
70.1
71.0
26.2
30.4
17.5
15.1
4.5
4.0
24.3
25.6
5.9
5.1
Hindustan Media
Neutral
267
-
1,960
1,016
1,138
24.3
25.2
27.3
30.1
9.8
8.9
1.9
1.7
16.2
15.8
1.3
1.1
Ventures
TV Today Network
Buy
315
385
1,880
637
743
27.5
27.5
18.4
21.4
17.2
14.7
3.0
2.5
17.4
17.2
2.6
2.1
Metals & Mining
Coal India
Neutral
307
-
193,849
84,638
94,297
21.4
22.3
24.5
27.1
12.5
11.3
5.2
5.0
42.6
46.0
1.8
1.6
Hind. Zinc
Neutral
250
-
105,443
14,252
18,465
55.9
48.3
15.8
21.5
15.8
11.6
2.6
2.3
17.0
20.7
7.4
5.7
Hindalco
Neutral
166
-
34,176
107,899
112,095
7.4
8.2
9.2
13.0
18.0
12.7
0.9
0.8
4.8
6.6
0.8
0.8
JSW Steel
Neutral
1,691
-
40,869
53,201
58,779
16.1
16.2
130.6
153.7
13.0
11.0
1.7
1.5
14.0
14.4
1.5
1.3
NMDC
Neutral
114
-
36,053
6,643
7,284
44.4
47.7
7.1
7.7
16.1
14.8
1.4
1.4
8.8
9.2
3.2
2.9
SAIL
Neutral
49
-
20,341
47,528
53,738
(0.7)
2.1
(1.9)
2.6
18.9
0.5
0.5
(1.6)
3.9
1.3
1.2
Vedanta
Neutral
203
-
60,287
71,744
81,944
19.2
21.7
13.4
20.1
15.2
10.1
1.3
1.2
8.4
11.3
1.2
0.9
Tata Steel
Neutral
385
-
37,402
121,374
121,856
7.2
8.4
18.6
34.3
20.7
11.2
1.3
1.2
6.1
10.1
0.9
0.9
Oil & Gas
Cairn India
Neutral
227
-
42,466
9,127
10,632
4.3
20.6
8.8
11.7
25.7
19.4
0.8
0.8
3.3
4.2
6.1
5.1
GAIL
Neutral
427
-
54,208
56,220
65,198
9.3
10.1
27.1
33.3
15.8
12.8
1.4
1.3
9.3
10.7
1.2
1.0
ONGC
Neutral
275
-
235,533
137,222
152,563
15.0
21.8
19.5
24.1
14.1
11.4
1.2
1.1
8.5
10.1
2.0
1.8
Indian Oil Corp
Neutral
301
-
146,017
373,359
428,656
5.9
5.5
54.0
59.3
5.6
5.1
0.9
0.8
16.0
15.6
0.5
0.5
Reliance Industries
Neutral
988
-
320,191
301,963
358,039
12.1
12.6
87.7
101.7
11.3
9.7
1.2
1.1
10.7
11.3
1.5
1.3
Pharmaceuticals
Alembic Pharma
Neutral
602
-
11,353
3,483
4,083
20.2
21.4
24.3
30.4
24.8
19.8
5.6
4.5
25.5
25.3
3.2
2.6
Aurobindo Pharma
Buy
722
877
42,246
15,720
18,078
23.7
23.7
41.4
47.3
17.4
15.3
4.5
3.5
29.6
26.1
2.9
2.5
Sanofi India*
Neutral
4,232
-
9,747
2,277
2,597
17.3
18.3
149.4
172.0
28.3
24.6
4.7
3.8
25.1
28.8
4.0
3.2
Cadila Healthcare
Accumulate
373
400
38,227
10,429
12,318
22.6
22.0
16.9
19.2
22.1
19.5
5.6
4.5
28.5
25.7
3.7
3.0
Cipla
Reduce
550
490
44,176
15,378
18,089
17.4
18.4
21.6
27.2
25.5
20.2
3.3
2.9
13.7
15.2
3.1
2.6
Stock Watch
November 21, 2016
Company Name
Reco
CMP
Target
Mkt Cap
Sales ( Čcr )
OPM(%)
EPS (Č)
PER(x)
P/BV(x)
RoE(%)
EV/Sales(x)
(Č)
Price ( Č)
( Č cr )
FY17E FY18E
FY17E
FY18E
FY17E
FY18E
FY17E
FY18E
FY17E
FY18E
FY17E
FY18E
FY17E
FY18E
Pharmaceuticals
Dr Reddy's
Neutral
3,212
-
53,222
16,043
18,119
20.8
22.4
112.4
142.9
28.6
22.5
3.8
3.3
14.1
15.9
3.3
2.9
Dishman Pharma
Neutral
239
-
3,856
1,718
1,890
22.7
22.8
9.5
11.3
25.2
21.1
2.4
2.2
10.1
10.9
2.7
2.4
GSK Pharma*
Neutral
2,710
-
22,952
3,000
3,312
15.4
20.6
46.5
60.8
58.3
44.6
14.0
13.9
26.3
30.6
7.4
6.7
Indoco Remedies
Sell
283
240
2,608
1,112
1,289
16.2
18.2
11.6
16.0
24.4
17.7
3.9
3.3
17.0
20.1
2.5
2.1
Ipca labs
Accumulate
542
613
6,841
3,303
3,799
15.3
15.3
17.3
19.7
31.3
27.5
2.7
2.5
9.1
9.4
2.2
1.9
Lupin
Buy
1,417
1,809
63,897
15,912
18,644
26.4
26.7
58.1
69.3
24.4
20.5
4.7
3.9
21.4
20.9
4.1
3.4
Sun Pharma
Buy
688
847
165,641
31,129
35,258
32.0
32.9
30.2
35.3
22.8
19.5
3.7
3.1
20.0
20.1
4.9
4.1
Power
Tata Power
Neutral
70
-
18,946
36,916
39,557
17.4
27.1
5.1
6.3
13.7
11.1
1.2
1.1
9.0
10.3
1.5
1.4
NTPC
Neutral
159
-
130,773
86,605
95,545
17.5
20.8
11.8
13.4
13.4
11.8
1.4
1.3
10.5
11.1
2.9
2.8
Power Grid
Neutral
192
-
100,394
25,763
29,762
74.3
73.1
14.8
17.3
13.0
11.1
2.0
1.8
16.9
17.5
8.2
7.7
Real Estate
MLIFE
Buy
371
522
1,520
1,152
1,300
22.7
24.6
29.9
35.8
12.4
10.4
0.9
0.9
7.6
8.6
2.0
1.7
Telecom
Bharti Airtel
Neutral
303
-
121,121
105,086
114,808
34.5
34.7
12.2
16.4
24.8
18.5
1.7
1.6
6.8
8.4
2.1
1.8
Idea Cellular
Neutral
71
-
25,584
40,133
43,731
37.2
37.1
6.4
6.5
11.1
10.9
0.9
0.9
8.2
7.6
1.7
1.4
zOthers
Abbott India
Neutral
4,524
-
9,614
3,153
3,583
14.1
14.4
152.2
182.7
29.7
24.8
146.0
124.6
25.6
26.1
2.8
2.4
Bajaj Electricals
Buy
215
274
2,173
4,801
5,351
5.7
6.2
10.4
13.7
20.6
15.7
2.6
2.3
12.4
14.5
0.4
0.4
Finolex Cables
Neutral
389
-
5,949
2,883
3,115
12.0
12.1
14.2
18.6
27.4
20.9
14.6
12.7
15.8
14.6
1.8
1.6
Goodyear India*
Neutral
719
-
1,658
1,598
1,704
10.4
10.2
49.4
52.6
14.6
13.7
67.2
58.9
18.2
17.0
0.7
100.5
Hitachi
Neutral
1,245
-
3,386
2,081
2,433
8.8
8.9
33.4
39.9
37.3
31.2
30.1
25.1
22.1
21.4
1.6
1.4
Jyothy Laboratories
Neutral
350
-
6,351
1,440
2,052
11.5
13.0
8.5
10.0
41.2
35.0
10.0
9.2
18.6
19.3
4.7
3.3
Page Industries
Neutral
13,185
-
14,706
2,450
3,124
20.1
17.6
299.0
310.0
44.1
42.5
293.7
224.2
47.1
87.5
6.1
4.8
Relaxo Footwears
Neutral
404
-
4,853
2,085
2,469
9.2
8.2
7.6
8.0
53.5
50.9
20.7
17.7
17.9
18.8
2.4
2.1
Siyaram Silk Mills
Accumulate
1,225
1,714
1,148
1,799
2,040
11.6
11.7
104.9
122.4
11.7
10.0
1.9
1.6
16.4
16.4
0.8
0.7
Styrolution ABS India*
Neutral
576
-
1,013
1,440
1,537
9.2
9.0
40.6
42.6
14.2
13.5
36.2
32.9
12.3
11.6
0.7
0.6
TVS Srichakra
Neutral
3,215
-
2,461
2,304
2,614
13.7
13.8
231.1
266.6
13.9
12.1
361.2
284.4
33.9
29.3
1.1
0.9
HSIL
Neutral
296
-
2,142
2,384
2,515
15.8
16.3
15.3
19.4
19.4
15.3
19.2
16.6
7.8
9.3
1.1
1.0
Kirloskar Engines India
Neutral
340
-
4,910
2,554
2,800
9.9
10.0
10.5
12.1
32.3
28.1
13.5
12.8
10.7
11.7
1.6
1.4
Ltd
M M Forgings
Neutral
427
-
516
546
608
20.4
20.7
41.3
48.7
10.4
8.8
58.5
51.8
16.6
17.0
0.8
0.7
Banco Products (India)
Neutral
175
-
1,249
1,353
1,471
12.3
12.4
14.5
16.3
12.1
10.7
16.6
15.0
14.5
14.6
0.9
92.2
Competent Automobiles Neutral
160
-
98
1,137
1,256
3.1
2.7
28.0
23.6
5.7
6.8
30.8
27.8
14.3
11.5
0.1
0.1
Stock Watch
November 21, 2016
Company Name
Reco
CMP
Target
Mkt Cap
Sales ( Čcr )
OPM(%)
EPS (Č)
PER(x)
P/BV(x)
RoE(%)
EV/Sales(x)
(Č)
Price ( Č)
( Č cr )
FY17E
FY18E
FY17E
FY18E
FY17E
FY18E
FY17E
FY18E
FY17E
FY18E
FY17E
FY18E
FY17E
FY18E
zOthers
Nilkamal
Neutral
1,284
-
1,917
1,995
2,165
10.7
10.4
69.8
80.6
18.4
15.9
73.4
63.8
16.6
16.5
1.0
0.8
Visaka Industries
Neutral
177
-
281
1,051
1,138
10.3
10.4
21.0
23.1
8.4
7.7
22.7
21.3
9.0
9.2
0.5
0.5
Transport Corporation of
Neutral
172
-
1,318
2,671
2,911
8.5
8.8
13.9
15.7
12.4
11.0
1.7
1.5
13.7
13.8
0.6
0.6
India
Elecon Engineering
Neutral
49
-
530
1,482
1,660
13.7
14.5
3.9
5.8
12.5
8.4
2.9
2.7
7.8
10.9
0.7
0.6
Surya Roshni
Neutral
201
-
879
3,342
3,625
7.8
7.5
17.3
19.8
11.6
10.2
22.0
17.7
10.5
10.8
0.5
0.5
MT Educare
Neutral
112
-
448
366
417
17.7
18.2
9.4
10.8
12.0
10.4
2.7
2.3
22.2
22.3
1.1
1.0
Radico Khaitan
Buy
118
147
1,573
1,667
1,824
13.0
13.2
6.7
8.2
17.8
14.4
1.6
1.5
9.0
10.2
1.3
1.2
Garware Wall Ropes
Neutral
588
-
1,286
873
938
14.3
14.3
35.2
37.5
16.7
15.7
2.9
2.5
17.5
15.9
1.4
1.3
Wonderla Holidays
Neutral
338
-
1,908
287
355
38.0
40.0
11.3
14.2
29.9
23.8
4.3
3.7
21.4
23.9
6.3
5.1
Linc Pen & Plastics
Neutral
245
-
362
382
420
9.3
9.5
13.5
15.7
18.2
15.6
3.1
2.7
17.1
17.3
1.0
0.9
The Byke Hospitality
Neutral
174
-
697
287
384
20.5
20.5
7.6
10.7
22.9
16.3
4.8
3.9
20.7
23.5
2.4
1.8
Interglobe Aviation
Neutral
849
-
30,591
21,122
26,005
14.5
27.6
110.7
132.1
7.7
6.4
45.9
32.8
168.5
201.1
1.4
1.1
Coffee Day Enterprises
Neutral
208
-
4,282
2,964
3,260
20.5
21.2
4.7
8.0
-
26.0
2.4
2.2
5.5
8.5
1.9
1.6
Ltd
Navneet Education
Neutral
107
-
2,537
1,062
1,147
24.0
24.0
6.1
6.6
17.5
16.1
3.6
3.2
20.6
19.8
2.5
2.3
Navkar Corporation
Buy
179
265
2,557
408
612
42.9
42.3
6.8
11.5
26.5
15.6
1.8
1.6
6.9
10.5
7.2
4.8
UFO Moviez
Neutral
427
-
1,179
619
685
33.2
33.4
30.0
34.9
14.3
12.2
2.0
1.7
13.8
13.9
1.6
1.3
VRL Logistics
Neutral
268
-
2,442
1,902
2,119
16.7
16.6
14.6
16.8
18.4
15.9
4.0
3.5
21.9
22.2
1.4
1.2
Team Lease Serv.
Neutral
882
-
1,507
3,229
4,001
1.5
1.8
22.8
32.8
38.7
26.8
4.2
3.6
10.7
13.4
0.4
0.3
S H Kelkar & Co.
Neutral
287
-
4,144
1,036
1,160
15.1
15.0
6.1
7.2
46.9
39.9
5.0
4.6
10.7
11.5
3.9
3.4
Quick Heal
Neutral
233
-
1,633
408
495
27.3
27.0
7.7
8.8
30.1
26.5
2.8
2.8
9.3
10.6
3.1
2.6
Narayana Hrudaya
Neutral
331
-
6,764
1,873
2,166
11.5
11.7
2.6
4.0
125.1
83.5
7.7
6.9
6.1
8.3
3.7
3.2
Manpasand Bever.
Neutral
664
-
3,797
836
1,087
19.6
19.4
16.9
23.8
39.3
27.9
4.7
4.1
12.0
14.8
4.3
3.2
Parag Milk Foods
Neutral
266
-
2,237
1,919
2,231
9.3
9.6
9.5
12.9
28.2
20.6
4.4
3.6
15.5
17.5
1.3
1.1
Mirza International
Buy
73
107
878
987
1,106
18.0
18.0
6.5
7.6
11.2
9.6
1.8
1.5
15.9
15.7
1.1
1.0
Asian Granito
Buy
196
351
588
1,071
1,182
12.1
12.4
12.7
16.0
15.4
12.2
1.5
1.3
9.5
10.7
0.9
0.7
Source: Company, Angel Research; Note: *December year end; #September year end; &October year end; Price as on November 19, 2016
Market Outlook
November 21, 2016
Research Team Tel: 022 - 39357800
DISCLAIMER
Angel Broking Private Limited (hereinafter referred to as “Angel”) is a registered Member of National Stock Exchange of India
Limited,Bombay Stock Exchange Limited and Metropolitan Stock Exchange Limited. It is also registered as a Depository Participant with
CDSL and Portfolio Manager with SEBI. It also has registration with AMFI as a Mutual Fund Distributor. Angel Broking Private Limited is a
registered entity with SEBI for Research Analyst in terms of SEBI (Research Analyst) Regulations, 2014 vide registration number
INH000000164. Angel or its associates has not been debarred/ suspended by SEBI or any other regulatory authority for accessing
/dealing in securities Market. Angel or its associates/analyst has not received any compensation / managed or
co-managed public offering of securities of the company covered by Analyst during the past twelve months.
This document is solely for the personal information of the recipient, and must not be singularly used as the basis of any investment
decision. Nothing in this document should be construed as investment or financial advice. Each recipient of this document should make
such investigations as they deem necessary to arrive at an independent evaluation of an investment in the securities of the companies
referred to in this document (including the merits and risks involved), and should consult their own advisors to determine the merits and
risks of such an investment.
Reports based on technical and derivative analysis center on studying charts of a stock's price movement, outstanding positions and
trading volume, as opposed to focusing on a company's fundamentals and, as such, may not match with a report on a company's
fundamentals. Investors are advised to refer the Fundamental and Technical Research Reports available on our website to evaluate the
contrary view, if any.
The information in this document has been printed on the basis of publicly available information, internal data and other reliable
sources believed to be true, but we do not represent that it is accurate or complete and it should not be relied on as such, as this
document is for general guidance only. Angel Broking Pvt. Limited or any of its affiliates/ group companies shall not be in any way
responsible for any loss or damage that may arise to any person from any inadvertent error in the information contained in this report.
Angel Broking Pvt. Limited has not independently verified all the information contained within this document. Accordingly, we cannot
testify, nor make any representation or warranty, express or implied, to the accuracy, contents or data contained within this document.
While Angel Broking Pvt. Limited endeavors to update on a reasonable basis the information discussed in this material, there may be
regulatory, compliance, or other reasons that prevent us from doing so.
This document is being supplied to you solely for your information, and its contents, information or data may not be reproduced,
redistributed or passed on, directly or indirectly.
Neither Angel Broking Pvt. Limited, nor its directors, employees or affiliates shall be liable for any loss or damage that may arise from
or in connection with the use of this information.